
New research shows that from 1992–2013, severe heatwaves caused the most economic harm in “poor tropical regions,” which emit the least glasshouse gases.
Extreme temperatures destroy crops and reduce worker productivity, slowing economic growth. Climate change-induced heatwaves cost the global economy trillions of dollars between 1992 and 2013, according to a Science Advances study.
According to the report, extreme heat has already reduced per-person GDP in tropical nations like Brazil, Venezuela, and Mali by over 5% each year. High-latitude countries like Canada and Finland have only lost 1% of GDP every year.
A scientist not involved in the article says the findings “reinforce the conclusions of earlier studies that the harmful consequences of climate change are greater in some of the countries that had the lowest historical contributions to the glasshouse gas emissions”.
Climate change is costing the economy.
“It’s happening now,” the study’s lead author tells Carbon Brief. “Human-caused escalation of high heat” has damaged “basically all economies,” he says, with tropical nations suffering the most.
Heatwaves
Heat may harm people and ecosystems worldwide. Hospital admissions increased due to heat stress during the “record-shattering” Pacific north-west heatwave of 2021.
The next summer, extreme heat across India lowered agricultural yields by 10-35% in some locations, causing food prices to rise and food insecurity.
Heat exposure cost $669bn in 2021, according to the Lancet Countdown report on climate change. Heatwaves in 2020 caused moderate-to-severe food insecurity for 100 million more people than in prior decades.
According to Carbon Brief, excessive heat has the “most evident” effects on labour and crops. Heatwaves can also harm mental health, he adds.
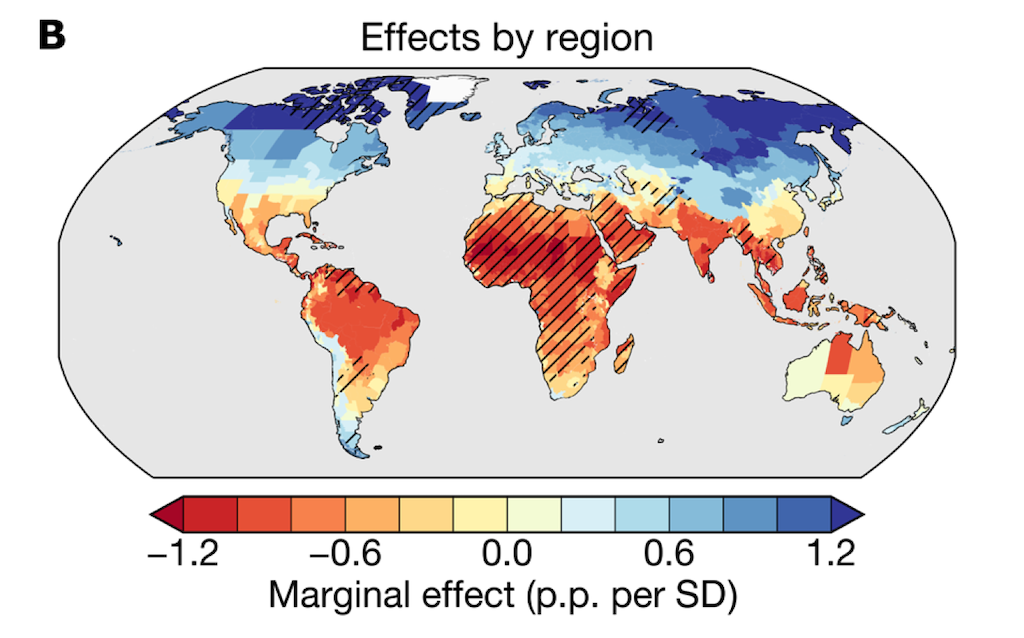
The study finds a statistical association between economic growth and temperature over 1992–2013. The map below shows how a one-standard-deviation temperature increase affects economic growth. The report defines “regions” as “subnational administrative levels” like US states.
Red colouring represents regions where a one-standard-deviation temperature rise lowers economic growth, whereas blue suggests expansion. Darker shading has more impact. Hatching means subnational economic data was extrapolated from elsewhere.
Subnational data on area economic growth and one standard deviation average temperature increase. Callahan & Mankin (2022).
The graphic illustrates that a single-standard-deviation temperature increase hurts practically all southern hemisphere locations, whereas northern hemisphere regions prosper economically. The study argues 14C is a “ideal” absolute average for economic performance.
In Brazil, where the average temperature is 23.8C, increasing temperature slows growth by 0.63 percentage points. Norway, with an average temperature of 4C, grows 0.62 percent every standard deviation.
Because the global economy is interconnected, Callahan says it is “misleading” to imply that climate change benefits northern hemisphere countries. Explains:
While an increase in temperature theoretically may benefit high latitude and wealthy regions, human-caused intensification of intense heat has damaged basically all economies.”
Countries’ heatwave recovery times are also examined. Repeated heat extremes may cause “tangible long-term income impacts,” they found.
Costs
Heatwaves are become longer, more frequent, and hotter as the earth warms. Heatwaves—defined as an extended stretch of hot weather relative to the usual circumstances for that time of year—can be measured in several ways.
This study examines a global sample of subnational regions’ warmest five-day period (Tx5d) from 1992 to 2013. They then used CMIP6 climate models to calculate Tx5d for each year in a world without climate change. Comparison shows how human-caused warming has affected Tx5d.
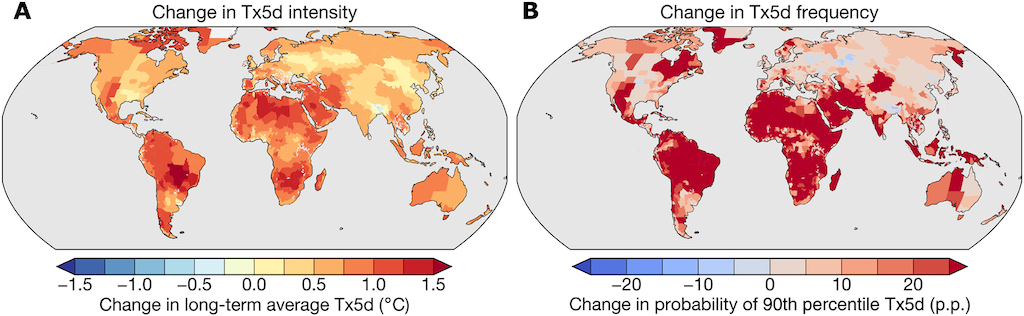
The left map demonstrates how global warming has increased Tx5d temperature. Climate change increases high heat risk, as shown on the right map. Darker reds show the greatest rises.
Human-caused high heat over 1992–2013, assessed by the warmest annual 5-day period (Tx5d). Maps indicate intensity change (left) and probability change (right) of each region’s counterfactual 90th percentile Tx5d value. Callahan & Mankin (2022).
Over 1992–2013, warming raised Tx5d values 0.77C globally. They say that tropical countries experience a 1C increase, while the US experiences less than 0.5C.
The authors then calculate the economic harm from hotter heatwaves. The maps below demonstrate the percentage (left) and absolute (right) changes in per-capita GDP from 1992-2013 due to human-caused excessive heat. Redder indicates more damage.
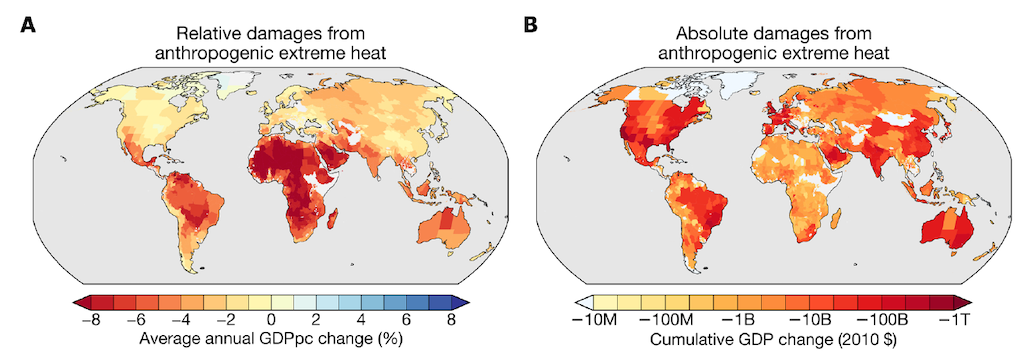
Changes in per-capita GDP due to anthropogenic excessive heat intensity from 1992 to 2013. Callahan & Mankin (2022).
Over 1992–2013, worsening heatwaves “likely” cost the global economy $5tn to $29tn. Callahan informs Carbon Brief that several analysis processes have uncertainties, so this range is enormous.
This damage is unevenly distributed worldwide. The analysis found that regions in the lowest 10% of incomes lost 6.7% of GDP per person each year over 1992–2013, while regions in the top 10% lost only 1.5%.
Heatwaves have reduced GDP by at least 5% each year in Brazil, Venezuela, and Mali, but just 1% in Canada and Finland.
Dr. Leonie Wenz, deputy chair of Potsdam Institute for Climate Impact Research’s “complexity science” research department, says climate change economics research has been “primarily reliant on averages” until recently.
Wenz, who was not involved in the study, tells Carbon Brief that averages “can disguise the true consequences of local and transient occurrences [and] may not fully reflect how we as humans feel temperature”. She applauds this study’s extraordinary emphasis.
Inequality
Climate justice is based on the assumption that wealthy and powerful people caused climate change, which disproportionately affects the poor and vulnerable.
The plot below compares income with the change in income induced by human-generated heatwaves for several counties. Heatwaves cause more economic damage to low-income countries (left) than high-income countries (right).
The graphic shows the US (blue) and Malawi (red), one of the poorest countries in the world. The dotted line in the middle of the plot demonstrates that the poorest countries emit just 11% of CO2. The highest-income countries, which suffer the least economic loss, emit 89%.
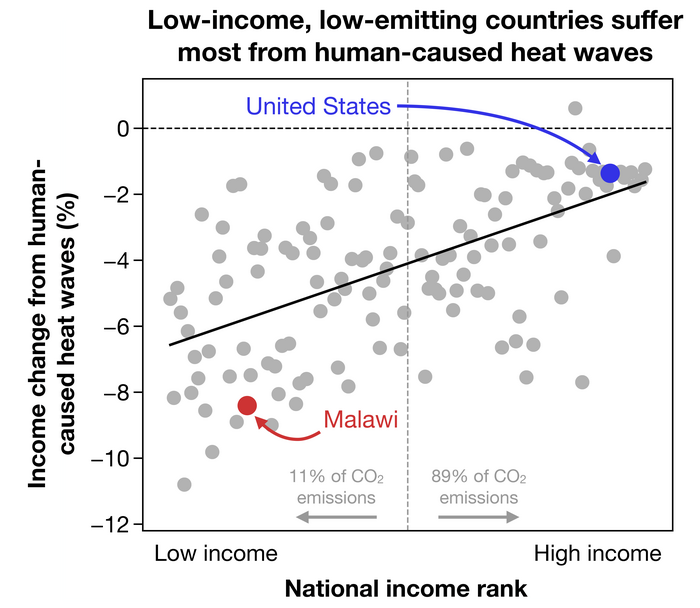
Income change due to worsening heatwaves for different income countries. Eurekalert, Callahan and Mankin data (2022).
Dr. Erich Fischer, a prominent scientist and lecturer at ETH Zurich who was not engaged in the study, called it “very important.” Says:
“[The findings] confirm the conclusions of earlier studies that the harmful consequences of climate change are greater in some of the countries with the lowest historical glasshouse gas emissions.”
He also emphasises that excessive heat “may be greatly enhanced by humidity – and these effects are largest in portions of the global south,” making the economic impact of heatwaves worse than the study implies.
Dr. Luke Harrington, a senior lecturer at the University of Waikato in New Zealand, has written about high heat’s effects and causes, generally focused on disadvantaged countries. He emphasises inequality findings:
This tendency exacerbates socioeconomic inequities, with the greatest impacts on those who have contributed least to climate change.
Low-income tropical regions generally lack climatic extreme data, the scientists add. Fischer tells Carbon Brief that the authors “clearly note” “severe data constraints both for climatic data as well as for economic data in the global south”. However, they “offer a considerable caveat” to the findings.
Dr. Izidine Pinto, a climate scientist at the University of Cape Town who was not involved in the study, says this paucity of data “makes it difficult to reach conclusions on global inequities”.
Carbon Brief interviewed Callahan on the absence of data in the global south, where “people tend to be the most susceptible.”
He compares it to “searching for your keys under the lamppost” since good data may bias the results. He states he intended to avoid this trap in his paper.
This study’s data extrapolation strategy for places with little data “comes with uncertainties,” Callahan says. He adds it’s “essential” to “completely capture the globally unequal nature of the consequences we observe”.
Callahan and Mankin (2022) Globally unequal economic development from excessive heat, Science Advances, doi:10.1126/sciadv.add3726.
Storyline excerpts
Source