
The research examines new pledges and the “gap” towards fulfilling the Paris targets and finds that while progress has been made to decrease emissions and deploy more clean energy, it is not enough to put the world on a path to limit temperature to well-below 2C or 1.5C this century.
In the year since COP26, it claims there has been “little progress.”
The UNEP report warns that gradual change is “no longer an option” and that preventing hazardous warming will need a “wide-ranging, large-scale, rapid and systemic transformation.”
The analysis shows that current policies are likely to lead to 2.6C warming above pre-industrial levels, however uncertainties in the climate system mean that 4C warming is possible.
Meeting 2030 Nationally Determined Contributions (NDCs) under the Paris Agreement would likely raise global temperatures to 2.2C to 2.4C, while ambitious net-zero promises would restrict warming to 1.7C.
Over the past year, 74 countries have pledged longer-term net-zero emissions, covering 79% of global glasshouse gas emissions.
Many nations have yet to pass substantial measures or amend their 2030 NDCs to meet their net-zero goals. This mismatch “does not inspire confidence” that net-zero targets will be met, the paper states.
The research recommends “broad-based economy-wide reforms” to keep warming below 2C or 1.5C. “Every fraction of a degree matters” for future climate change implications, the paper states.
Rising greenhouse gas emissions.
The UNEP emissions gap report covers worldwide glasshouse gas emissions until 2021, including CO2, which drives long-term global warming, as well as methane, nitrous oxide, and fluorinated chemicals.
While 2021 CO2 emissions from land-use change are not yet known, other glasshouse gases show 2021 emissions are on pace with 2019’s record-high emissions.
Since 1990, the figure below shows CO2 from fossil fuels (black shading), land usage (green), methane (grey), nitrous oxide (blue), and fluorinated gases (orange).
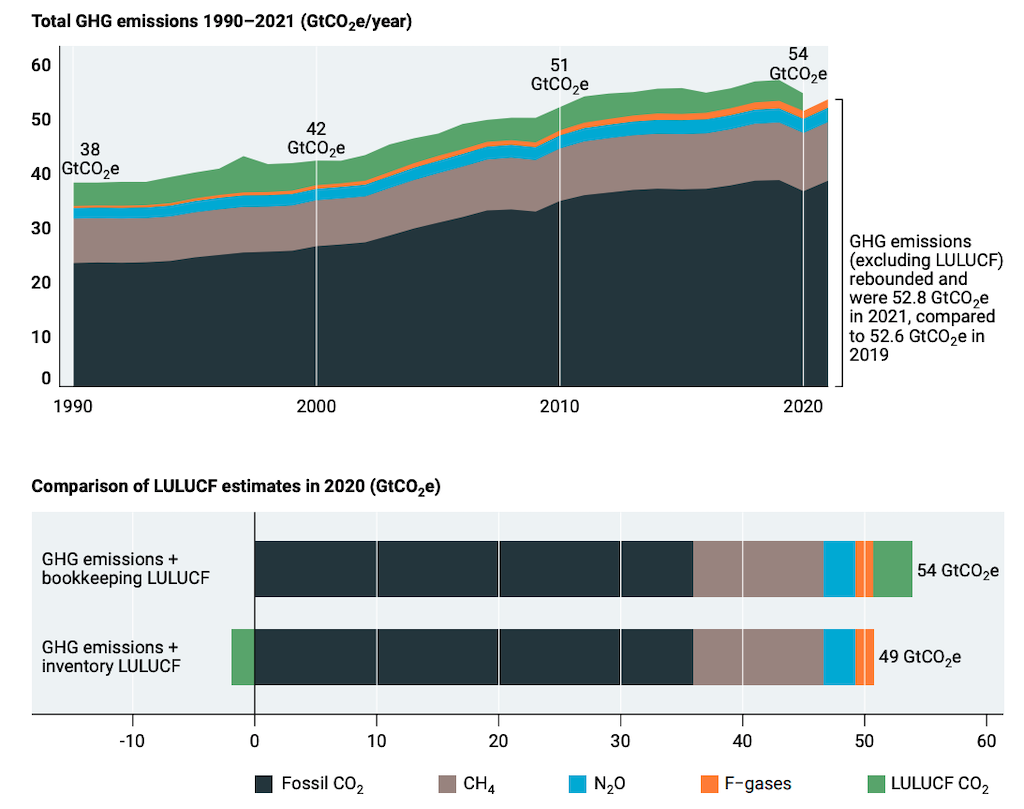
The 2021 emissions gap assessment found that the COVID-19 pandemic’s emissions drop was “short-lived.” In 2021, global coal and CO2 emissions increased. Methane and nitrous oxide emissions were unchanged, but fluorinated gas emissions increased.
Even if global glasshouse gas emissions haven’t peaked yet, emissions growth has slowed. The research notes that emissions increase throughout the 2010-19 period (excluding Covid-related declines) averaged 1.1% per year, compared to 2.6% per year during the prior decade (2000-2009).
The report lists 35 countries that have peaked in glasshouse gas emissions, accounting for 10% of world emissions.
Greenhouse gas emissions vary greatly between and within countries, according to the analysis. China (red) is the world’s top emitter of glasshouse gases, producing about three times as much as the US (grey) and more than four times as much as India (orange) and the EU (blue) (blue).
However, China’s per-capita glasshouse gas emissions (seen in the lower chart) are still a third lower than the US, 40% higher than Europe, and four times higher than India.
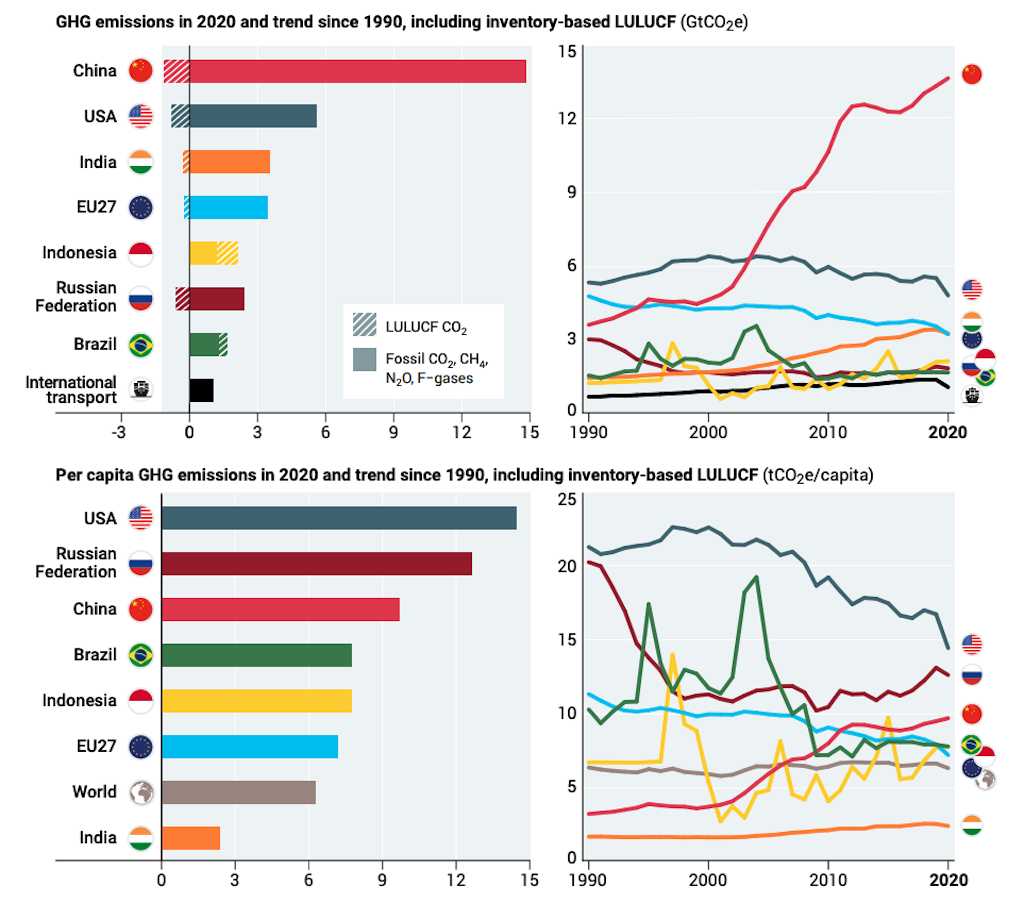
Greenhouse gas emissions per capita and overall by country. UNEP emissions gap study, Figure 2.2.
Emissions are also unequal within countries. The wealthiest 1% emit 17% of global emissions, whereas the bottom 50% emit 12%. The UNEP analysis observed this pattern in all major countries: high-income households emit a disproportionate percentage of national emissions.
In the graphic below, triangles represent emissions from the top 1% and inverted triangles from the bottom 50%. (to the left-hand side)
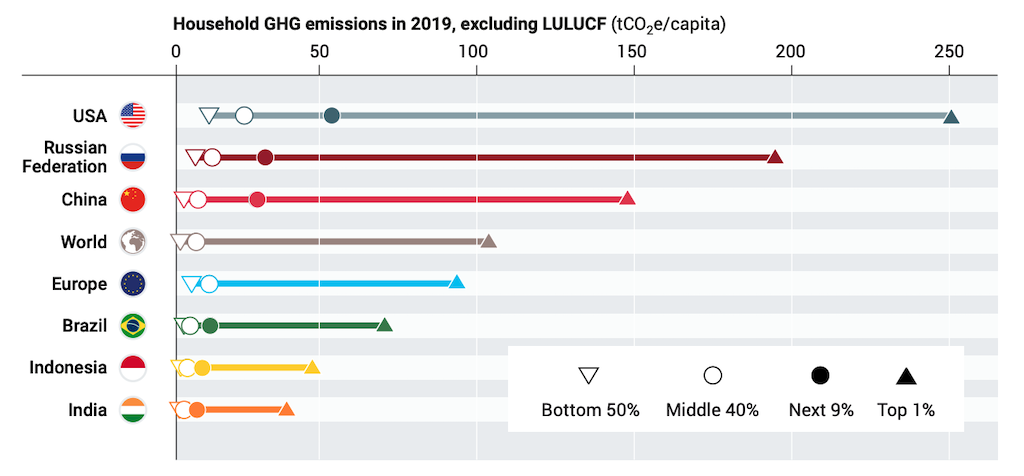 Global household glasshouse gas emissions by income. UNEP emissions gap study, Figure 2.3.
Huge “emissions gap” between Paris targets and obligations
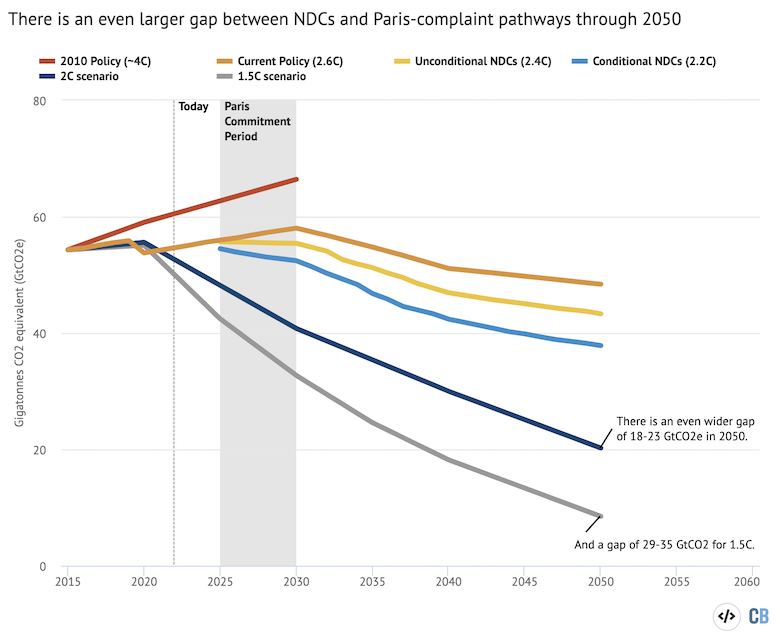
The paper analyses the “emissions gap” between countries’ Paris NDCs and what would be needed to keep warming below 2C. As shown below.
The report finds a 15GtCO2e emissions gap in 2030 between where the world is headed if countries achieve their “unconditional” NDCs (those not conditioned on green finance or other external assistance) – shown by the yellow line – and what is needed to put the world on track to limit warming to below 2C (defined in the report as a >66% chance of avoiding 2C warming) – shown by the dark blue line.
The gap between unconditional NDCs and a scenario consistent with 1.5C warming by the end of the century is 23GtCO2e (grey line). For both 2C and 1.5C scenarios, conditional NDCs (light blue line) would reduce this emissions gap by 3GtCO2e by 2030.
Countries may not even be on track to meet their NDCs. Based on government-enacted policies, the UNEP estimates current policy emissions (orange line). Through 2030, these are 3GtCO2e higher than conditional NDCs and 6Gt higher than unconditional NDCs.
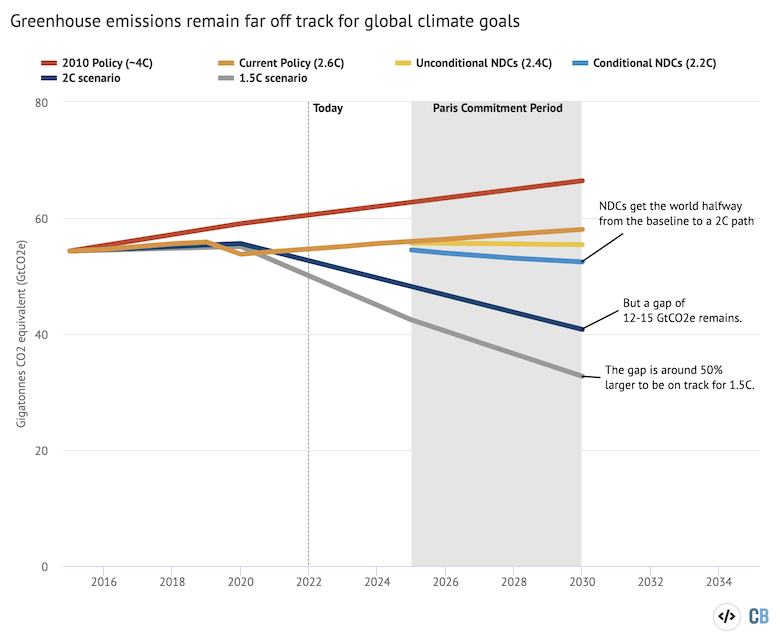
Median emission scenarios from UNEP’s 2022 Emission Gap Report. Red represents no new climate policies after 2010, orange shows existing policies, yellow and light blue show extra conditional and unconditional NDCs, respectively. The dark blue line indicates emissions below 2C, and the grey line indicates emissions below 1.5C. Highcharts chart from Carbon Brief.
Due to methodological changes, comparing the 2022 emissions gap to last year’s is difficult.
Land-use emissions and global warming potential (GWP100) figures from the Intergovernmental Panel on Climate Change’s sixth assessment report (AR6) are now used to calculate the emissions gap (IPCC). According to the IPCC AR6 Working Group III scenario database, 1.5C and 2C scenario emissions have been revised.
Only Australia, Indonesia, and South Korea have adopted emission-reducing NDCs since COP26 in Glasgow. Most G20 members with tougher NDCs this year or in 2021 have begun implementing policies and initiatives to reach their increased targets. The Inflation Reduction Act’s approval in the US has reduced the UNEP report’s G20 emissions prediction by 1.3 GtCO2e.
The 2022 report extends existing policy and NDC scenarios to the middle of the 21st century to examine the emissions gap beyond 2030.
Median emission scenarios from Figure 4.3 of the 2022 UNEP Emission Gap Report include 2010, current policy, unconditional, and conditional NDC scenarios. Highcharts chart from Carbon Brief.
NDCs fall well short of 2C and 1.5C scenarios by 2050. Between unconditional NDCs and the 2C scenario, there is a 23GtCO2e gap, and for the 1.5C scenario, 35GtCO2. Conditional NDCs emit 18 and 29 GtCO2e, respectively.
The current policy scenario and unconditional and conditional NDCs differ by 5GtCO2e and 11GtCO2e, respectively.
The UNEP report’s extended current policy scenario falls short of Paris Agreement goals, but it represents an improvement over the 2010 policy scenario in earlier UNEP reports (shown in red). UNEP forecasts a 15-year plateau in global glasshouse gas emissions before a gradual decline.
As seen in the graphic below, if all countries met their net-zero pledges, global glasshouse gas emissions would drop.
According to the research, “in most cases, neither present policies nor NDCs now define a plausible path from 2030 towards the accomplishment of net-zero targets.” More must be done to meet these pledges.
However, the analysis reveals that if they were met, they would put the globe on course to be broadly consistent with scenarios that restrict warming to below 2C, but not 1.5C.
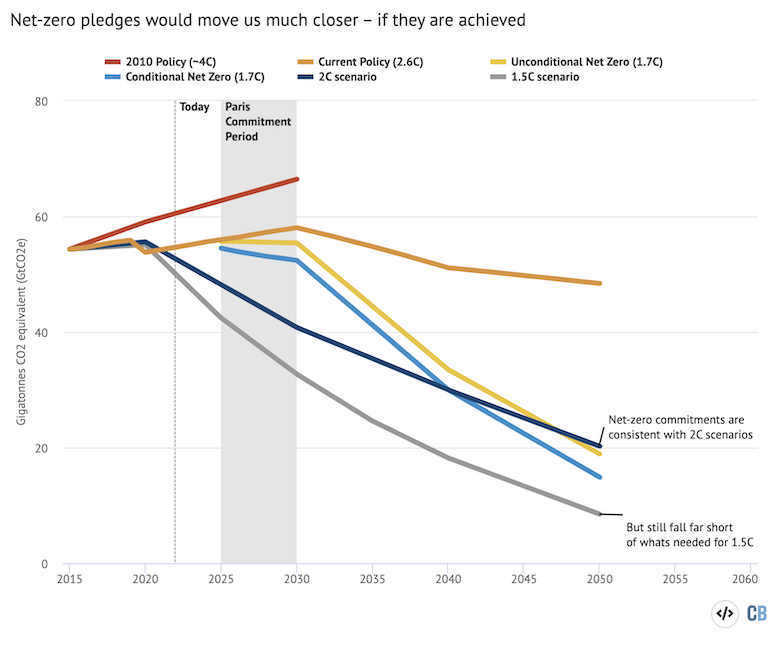
Median emission scenarios drawn from Figure 4.3 of the 2022 UNEP Emission Gap Report, using 2010, current policy, unconditional, and conditional nett zero commitment scenarios. Highcharts chart from Carbon Brief.
What’s the anticipated century-long warming?
In addition to examining emissions routes through 2030 and 2050, the UNEP report calculates the temperature range for each scenario.
They consider both emissions uncertainty (current policy, NDC, and net-zero pledges) and climate system uncertainty due to the climate’s sensitivity to emissions and probable carbon cycle feedbacks.
The image below compares the climate outcomes of the UNEP report to the IPCC’s five Shared Socioeconomic Pathways (SSPs) in the grey bars on the left (blue bars to the right).
These illustrate anticipated warming in 2100 compared to the pre-industrial period (1850-99) for the median (most likely) outcome, 10th, and 90th percentile model runs. The UNEP climate outcomes 90th percentile is available.
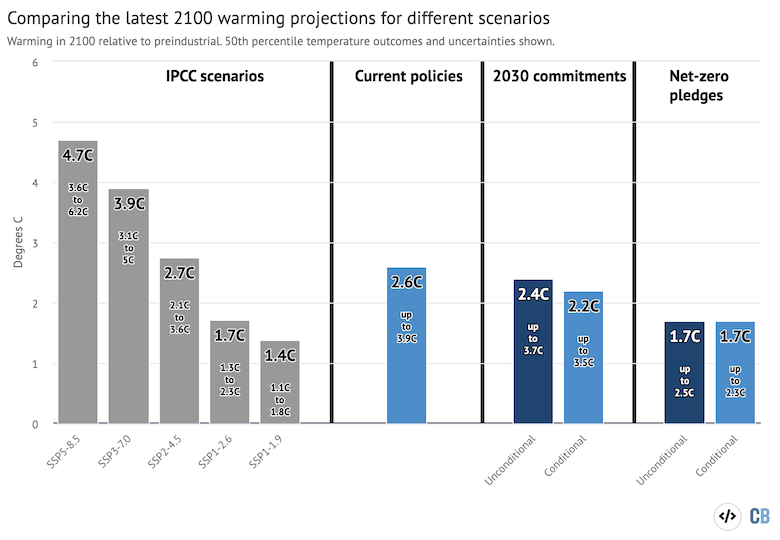
The UNEP report’s policy scenario is close to the modest-mitigation SSP2-4.5 scenario, with warming of 2.6C by 2100. The UNEP present policy scenario includes emissions and climate system uncertainties, while the SSP2-4.5 scenario only considers one emissions and concentration pathway.
Since greater climate policy and rapidly falling clean energy costs have reduced emissions over the previous decade, the current policy scenario is lower than the IPCC report’s two high-end emissions scenarios (SSP3-7.0 and SSP5-8.5).
The UNEP report’s 2010 policy scenario would have resulted in 4C warming, or SSP3-7.0 levels.
Countries that reach their unconditional NDCs would warm by 2.4C by 2100, with a high of 3.7C, whereas those that achieve their conditional NDCs would warm by 2.2C with a high of 3.5C.
Finally, achieving net-zero would restrict warming to 1.7C. (with a high-end of 2.5C and 2.3C for unconditional and conditional pledges, respectively). This is comparable to the SSP1-2.6 scenario, which has a two-in-three chance of avoiding more than 2C warming by 2100, but it is far from the SSP1-1.9 scenario that restricts warming to 1.5C by 2100.
These 2100 climatic outcomes are lower than last year’s emissions gap report forecasts, except for the current policy scenario. Below are the emissions gap climate outcomes for 2021 (red) and 2022 (blue).
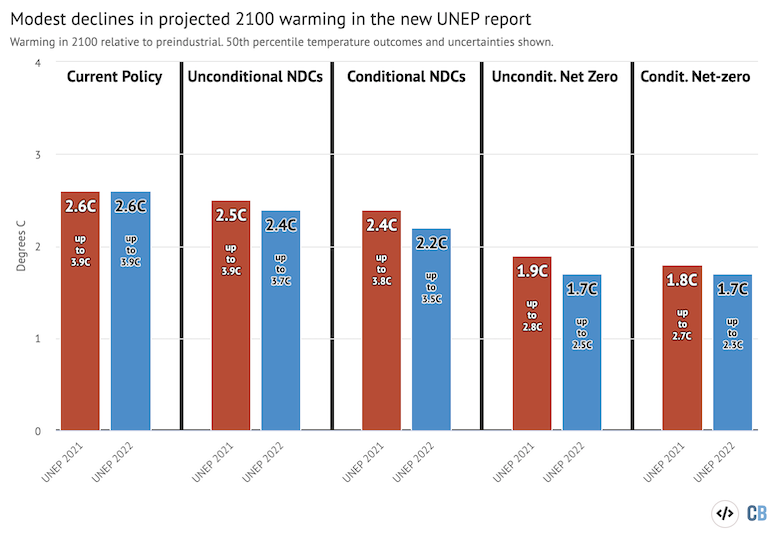
Global mean surface warming in 2100 relative to preindustrial levels from the 2021 and 2022 UNEP Emissions Gap report. The label shows 10th to 90th percentile uncertainty, whereas bars reflect the centre estimate (50th percentile). Highcharts chart from Carbon Brief.
These declines may be due to methodological changes and country pledges since the 2021 report and its COP26 addendum were issued. The unconditional NDC scenario decreased from 2.5C in the 2021 report to 2.4C, while the conditional NDC scenario decreased from 2.4C to 2.2C. Both unconditional and conditional net-zero pledge scenarios decrease from 1.9C to 1.7C.
The UNEP report stresses that emissions trajectories and climate system reactions greatly affect these predicted warming numbers. The chart below shows the probability of exceeding different global warming levels under present policies, unconditional NDCs, and unconditional net-zero promises.
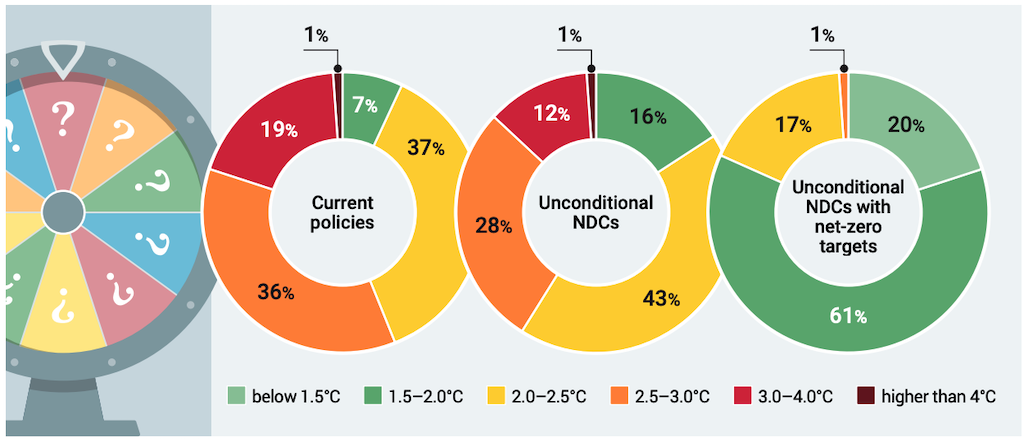
Global warming levels in 2100 compared to pre-industrial temperatures under several scenarios. UNEP emissions gap study, Figure 4.4.
The chart shows that a policy world with a central estimate of 2.6C has a 20% chance of exceeding 3C and a 1% risk of exceeding 4C.
Unconditional NDCs reduce the likelihood of reaching 3C to 13%. Only 1% of global temperatures will surpass 2.5C and 18% would exceed 2C if countries reach their net-zero commitments.
How to achieve global climate goals
To reduce warming to 1.5C, the “carbon budget” is relatively minimal.
380GtCO2, or nine years of current emissions, can be emitted before the globe has a 50-50 chance of exceeding 1.5C warming.
The remaining carbon budget after 2021, or seven years of current emissions, would be 280GtCO2 with a 66% likelihood of averting 1.5C warming.
The current IPCC report’s 1.5C scenarios enlarge this carbon budget by using negative emissions technologies (NETs), however these technologies have not been demonstrated at scale.
In the absence of net-negative emissions, emission pathways to limit warming to below 1.5C have a 50-50 chance, as shown in the figure below. The lines represent the emissions reductions needed assuming emissions peaked in each year between 2000 and 2031, with 2022 marked in grey.
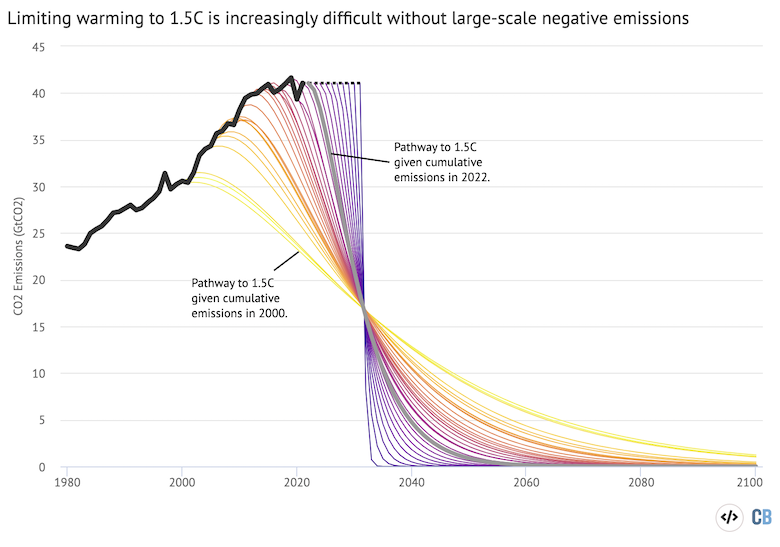
Emission reduction pathways having a 50% chance of limiting warming below 1.5C by starting year. The solid black line represents historical emissions, whereas the dotted line represents 2022 emissions. CO2 emissions from Global Carbon Project. Carbon budgets based on IPCC AR6. Robbie Andrews’ figures and data. Highcharts chart from Carbon Brief.
The 1.5C target would have been easier to accomplish if emissions had peaked and started to drop after 2000. Without NETs, limiting warming to 1.5C from 2022 to 2040 would require an annual 12% decrease.
With NETs, scenarios to restrict warming below 1.5C can be created that don’t require such a drastic emissions reduction. However, these require planetary-scale NET deployment to “suck” and lock away a quarter to half of the world’s annual human-caused CO2 emissions.
According to UNEP, worldwide emission reductions are needed to meet the 1.5C target. Delays will make the Paris Agreement’s “far below” 2C target harder than 1.5C.
Carbon Brief’s interactive chart shows the emission reductions needed by peaking year to fulfil the 2C target without net-negative emissions.
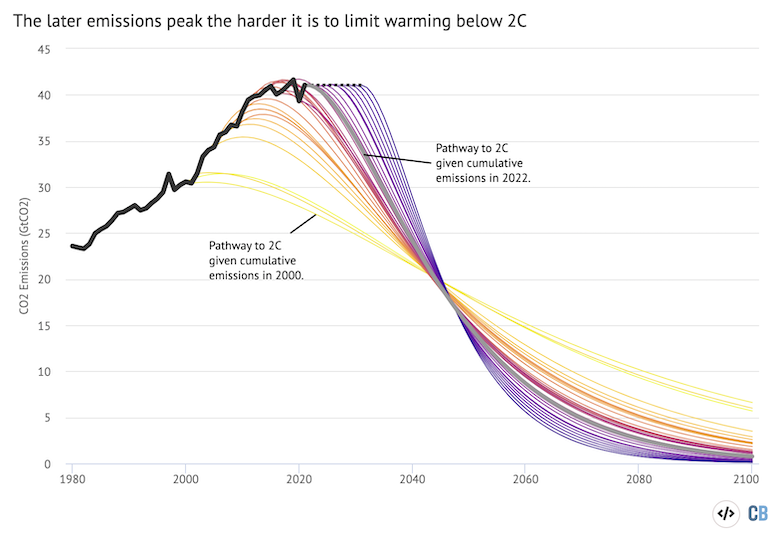
Emission reduction paths by starting year with a 66% chance of limiting warming below 2C without net-negative emissions. The solid black line represents historical emissions, whereas the dotted line represents 2022 emissions. CO2 emissions from Global Carbon Project. IPCC AR6-based below-2C carbon budgets. Robbie Andrews’ figures and data. Highcharts chart from Carbon Brief.
Emissions would have to reduce 2% a year to remain below 2C if the world started decreasing them in 2000. From 2022, emissions must reduce 5% a year to keep below 2C. If they don’t, the 2C carbon budget will be exhausted in 26 years.
There is a “rapidly closing window” to tighten climate policy and put the world on track to limit temperature to well-below 2C.
The UNEP report states that this will require “wide-ranging, large-scale, fast and systemic transformation.” The paper stresses that “every fraction of a degree matters” even if the 1.5C warming goal is unattainable.
It’s comparison to global estimations
The UNEP emissions gap report comes ahead of November’s COP27, the next global climate summit.
A UN Climate Change synthesis report examines the climate implications of countries’ current NDCs.
It finds that existing NDCs will raise emissions by 10.6% by 2030, putting the world on track for 2.5C of global warming. The difference between conditional and unconditional NDC pledges is reflected in our best estimate, which ranges from 2.1 to 2.9C.
This is a “marginal” improvement above NDCs submitted at COP26 in Glasgow last year, which would have increased emissions by 13.7% by 2030.
Several research institutions, including Climate Action Tracker and the World Resources Institute (WRI), found that the world is not doing enough to meet its 2030 climate targets across 40 indicators, from red-meat production and deforestation to climate finance and green hydrogen production.
Storylines
Source